


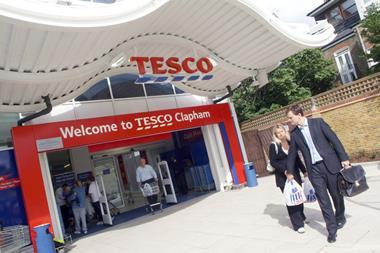
Tesco’s grocery market share has dropped significantly in the face of fierce competition according to new figures from Kantar Worldpanel.
The research body revealed the UK’s largest grocer saw its growth rate slow to half the market average at 2.1% causing a 0.6% fall in share from 30.5% in 2011 to 29.9% for the 12 weeks ending January 22, 2012.
By contrast Iceland enjoyed its strongest performance in 10 years rising from 1.9% in 2011 to 2.1% in 2012. The news comes as the auction for the frozen food retailer comes to a close at midnight tonight.
The grocery market is growing at 4.2% per year which remains below the food inflation rate as shoppers continue to seek value for money.
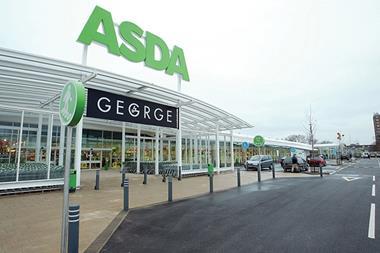
The completion of the Netto conversion has helped lift Asda’s share from 16.9% a year ago to 17.5% now, the largest share it has ever held.
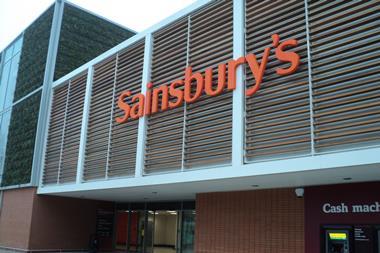
Sainsbury’s has also grown its share to 16.7%, consolidating its strongest hold of the market since March 2003. Morrisons share slipped slightly from 12.4% last year to 12.3% now.
Kantar Worldpanel director Edward Garner said: “There is considerable pressure on Tesco, with its growth rate of 2.1%, only half the total market average. This has caused its share to fall by 0.6 percentage points.
“Iceland’s 2.1% share is at its highest for 10 years as shoppers continue to manage down their spending. With bids for the chain closing today, these figures are promising for potential buyers and show the importance of a good value-for-money message in today’s grocery market.”
Elsewhere, Aldi and Lidl continue their strong run, both increasing their shares to 3.5% and 2.5% respectively. However, the disappearance of Netto means that the size of the total discount sector is relatively unchanged at 6%.
The Kantar Worldpanel analysis of market share and total till roll reads as below:
| 12 Weeks to 23 January 2011 | 12 Weeks to 22 January 2012 | change | |||
|---|---|---|---|---|---|
| £000s | % * | £000s | % * | % | |
| Total Till Roll | 35,226,420 | 36,225,140 | 2.8 | ||
| Total Grocers | 25,012,600 | 100.0% | 26,065,980 | 100.0% | 4.2 |
| Total Multiples | 24,482,190 | 97.9% | 25,531,640 | 98.0% | 4.3 |
| Tesco | 7,639,537 | 30.5% | 7,802,148 | 29.9% | 2.1 |
| Total Asda | 4,380,272 | 17.5% | 4,565,753 | 17.5% | 4.2 |
| Asda | 4,218,411 | 16.9% | 4,564,981 | 17.5% | 8.2 |
| Netto | 161,861 | 0.6% | 772 | 0.0% | -99.5 |
| Sainsbury’s | 4,142,029 | 16.6% | 4,349,426 | 16.7% | 5.0 |
| Morrisons | 3,095,148 | 12.4% | 3,209,006 | 12.3% | 3.7 |
| Co-operative | 1,656,969 | 6.6% | 1,638,609 | 6.3% | -1.1 |
| Somerfield | 23,726 | 0.1% | 4,308 | 0.0% | -81.8 |
| Waitrose | 1,056,397 | 4.2% | 1,132,895 | 4.3% | 7.2 |
| Iceland | 482,296 | 1.9% | 536,689 | 2.1% | 11.3 |
| Aldi | 770,446 | 3.1% | 922,260 | 3.5% | 19.7 |
| Lidl | 591,451 | 2.4% | 660,860 | 2.5% | 11.7 |
| Farm Foods | 127,598 | 0.5% | 137,608 | 0.5% | 7.8 |
| Other Multiples | 516,324 | 2.1% | 572,077 | 2.2% | 10.8 |
| Symbols & Independents | 530,408 | 2.1% | 534,343 | 2.0% | 0.7 |


No comments yet