


![]() PAID FOR POST
PAID FOR POST
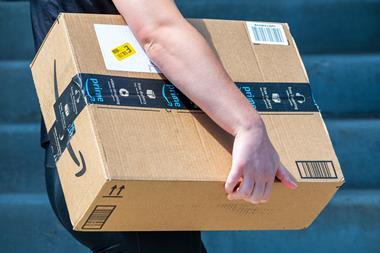
This peak season will be fiercely competitive but offers rich pickings to ecommerce businesses with the right information and the means to exploit it, argues Adverity’s Alexander Igelsböck
With an expected year-on-year growth between 15% and 35% in online shopping this peak season, businesses need to gear up for hypergrowth opportunities created by the pandemic.
What’s more, retailers are likely to see much lower footfall this year, making it even more important to optimise online customer acquisition.
The way to win this shopping season is to have full visibility through effective reports that enable you to chart your success and provide the rapid answers you need to upscale your operations.
For retailers new to the digital space and established etailers alike, here are five ecommerce reports that will help uncover customer insights and skyrocket sales:
1. Sales reports
The ability to track and measure sales plays a massive role in business growth and success. Great KPIs to track are sales by channel (eg: your website, social selling sites), by marketplace (Amazon, Shopify, etc) or by traffic referrals (search engines and affiliates).
Sales data can also be broken down further into product SKUs, billing country regions or products sold by direct-to-consumer retailers, to get even better intelligence. Armed with these insights, you can make sure you stabilise your supply chain, with the right level of stock available at the right time, and visibility of where you need to offer discounts based on low product demand.
Through data integration and harmonisation, it is possible to consolidate this data across your entire network of retailers and analyse like with like, despite differing partner data formats.
2. Marketing reports
Being able to measure marketing KPIs is essential and for retail marketers, return on ad spend (ROAS) is one of the most important metrics.
By automatically integrating sales data with advertising data you can accurately report on these figures across all of your channels without first having to create a manual report. It is also useful to combine sales and product metrics. By analysing data from previous sale seasons you can forecast more accurately for the new season and plan accordingly.
That said, you also need to be prepared for volatility, uncertainty, complexity and ambiguity this peak season.
You cannot assume what worked well last year will work well this year. As a result, retailers need to be prepared to capitalise on promoting products that pick up faster than expected and this means closely tracking your product and sales KPIs.
3. Conversion reports
Creating reports based on conversion data will go a step further to spot and exploit profitable customers, channels, products, campaign assets and geographies.
Key KPIs to display in your conversion dashboard include online store conversions, cart abandonments, discount code use and cost per conversion.
SEO data can also be a rich source of conversion information, measuring organic pages or keywords with the highest conversions.
4. Audience and behaviour reports
Modern ecommerce businesses need to keep a constant and close eye on their buyers and their behaviour. Among the key KPIs to track are audience demographics such as age and gender, geography and device. These have become table stakes.
If you want to be more sophisticated, you should track customer behaviour. Two metrics that will help are engagement – which can be tracked through sessions, session duration or page views – and whether they are new or returning customers.
5. A/B testing reports
The great thing about doing business online is you can correct parameters to quickly capitalise on sales spikes or respond rapidly to slumps. This is why it is worth tracking your A/B tests and reacting accordingly.
Traditional marketing metrics such as CTRs are KPIs worth incorporating into your A/B testing reports, as are cost per clicks and ROAS.
Another set of metrics worth tracking centres on cohort analysis, where you are comparing sets of sample customer groups side by side to see how they engage, behave and shop. Naturally, the way you advertise or speak to different cohorts will depend on their nature and behaviour.
KPIs such as retention rate, churn rate and lifetime value (LTV) can give you a steer on how profitable different cohorts are. You can then direct your resources firepower accordingly to attract, convert and retain them.
So, Black Friday, Cyber Monday, Halloween, Christmas, New Year – the peak season is upon us. Are you ready to steal a march on the competition?

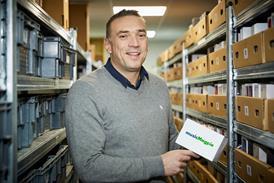
Alexander Igelsböck is CEO of Adverity
Data based efficiency has driven every stage of Alexander’s career. From the creation, growth and successful exit strategy applied to the multiple companies he has been involved with, to his latest role as co-founder and CEO of marketing data intelligence platform Adverity, powering smarter decisions with proactive analysis remains a key passion.