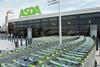
Asda’s market share slipped in the latest Kantar figures from 16.7% last year to 16.3%, while the discounters stole a larger share of shopper spend.

When Asda’s share is combined with Netto - which it is in the process of converting to smallers Asda Supermarkets - it stands at 16.9%.

For the 12 weeks ending June 12, the market share of Asda’s main competitors Tesco, Sainsbury’s and Morrisons remained relatively constant at 30.9%, 16.2% and 12% respectively.

Asda’s chief operating officer Simon King exited unexpectedly yesterday after just six months in the role.

An Asda spokesman said: “As we’ve said consistently, once you take out new space form the Kantar numbers, you get a slightly different picture. The fact remains we continue to do all the right things right now and what’s more, the first Netto conversions have exceeded our high expectations.”

The Kantar figures showed the grocery market growing at 4.7% per year, but the research house said that concealed a sharp slowdown after the Royal Wedding and Easter boost. Growth in the four weeks ending May 15 was 7.8% but slumped to 2.5% in the latest four weeks.

Kantar said a ‘two nations’ effect was evident in the period. Both Aldi and Lidl have grown at nearly 18% year on year and hold record shares of 3.4% and 2.6% respectively. In contrast, Waitrose posted the next highest growth of 8.9%. Kantar said further evidence of the ‘two nations’ trend was demonstrated by the double-digit growth of Tesco’s top-end Finest range.

Kantar Worldpanel communications director Edward Garner said: “The discounters are attracting some new customers but most of their growth is coming from gaining a greater share of the household shopping list. Customers are making a main shopping trip to their favourite store and this is then ‘topped up’ with selective shopping at the discounter – this has been dubbed ‘canny shopping’.”

Grocery inflation stands at 4.6% for the period.


MARKET SHARE - TOTAL TILL ROLL    
  12 Weeks to 13 June 2010  12 Weeks to 12 June 2011 change
 £000s%   * £000s %   *%
Total Till Roll  30,306,640   31,515,210 4.0
 Total Grocers       22,862,530100.0%       23,941,770100.0%4.7
   Total Multiples         22,338,05097.7%         23,389,65097.7%4.7
      Tesco             7,043,77030.8%             7,391,42530.9%4.9
      Total Asda             3,956,88017.3%             4,041,42916.9%2.1
        Asda             3,807,13916.7%             3,907,37616.3%2.6
        Netto                149,7410.7%                134,0530.6%-10.5
      Sainsbury’s             3,709,90016.2%             3,870,48616.2%4.3
      Morrisons             2,713,21711.9%             2,865,07212.0%5.6
      Co-operative               1,357,0425.9%             1,623,0286.8%19.6
      Somerfield                335,8081.5%                   8,9840.0%-97.3
      Waitrose                950,7224.2%             1,035,3094.3%8.9
      Iceland                426,6121.9%                454,2591.9%6.5
      Aldi                700,1283.1%                823,0403.4%17.6
      Lidl                527,9262.3%                622,6262.6%17.9
      Farm Foods                132,7360.6%                135,8290.6%2.3
      Other Multiples                483,3152.1%                518,1682.2%7.2
   Symbols & Independents              524,4782.3%              552,1172.3%5.3