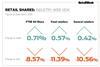
April 1, 2016: This week’s data on the biggest risers and fallers plus a comprehensive list of share price results in the retail sector.

shares chart April 1

Week’s biggest risers

 Mkt Cap (£m)Price (p)Change on week (p)Change on week (%)3-month change (%)PE
Sports Direct International 2,262.80 370.9 22.9 6.58 -26.17 9.13
Ao World 753.70 175 9 5.42 21.11 -
Marks & Spencer 6,591.00 407.3 14.8 3.77 -7.5 13.74
Topps Tiles 286.10 147.5 4.75 3.33 -3.13 21.87
Debenhams 923.20 73.75 1.5 2.08 11.15 9.7

Week’s biggest fallers

 Mkt Cap (£m)Price (p)Change on week (p)Change on week (%)3-month change (%)PE
Findel 162.50 176.75 -48 -21.36 -7.16 5.92
Poundland 419.2 151.25 -14.75 -8.89 -7.03 13.28
Ted Baker 1,197.30 2632 -132 -4.78 -4.46 26.19
French Connection 43.50 45 -2.25 -4.76 13.48 12.83
Next 8,131.40 5445 -210 -3.71 -22.19 12.1

FTSE All Share companies

 Mkt Cap (£m)Price (p)Change on week (p)Change on week (%)3-month change (%)PE
Tesco 15,614.60 190 0.25 0.13 37.75 2.68
Kingfisher 8,592.60 378.6 5.85 1.57 14.44 21.3
Next 8,131.40 5445 -210 -3.71 -22.19 12.1
Marks & Spencer 6,591.00 407.3 14.8 3.77 -7.5 13.74
Burberry Group 6,074.80 1327 7 0.53 26.62 17.4
J Sainsbury 5,317.30 276.6 1.1 0.4 15.73 31.84
Dixons Carphone 4,908.70 424.80 7.3 1.75 -9.4 45.54
Morrison Supermarket 4,640.00 199.9 -0.1 -0.05 32.59 21.02
B&M 2,654.00 262.8 1.55 0.59 6.67 77.31
Sports Direct International 2,262.80 370.9 22.9 6.58 -26.17 9.13
JD Sports Fashion 2,191.70 1114 10 0.91 7.85 31.66
WHSmith 2,077.20 1827 27 1.5 6.01 21
Dunelm Group 1,851.90 908 -13 -1.41 1.95 19.08
Ocado Group 1,814.50 300.7 -9.05 -2.92 -0.75 -
Home Retail 1,348.70 166 -0.5 -0.3 21.88 17.63
Pets at Home Group 1,345.50 265 -5.5 -2.03 6.32 18.42
Ted Baker 1,197.30 2632 -132 -4.78 -4.46 26.19
SuperGroup 1,153.50 1421 24 1.72 -7.73 25.32
Card Factory 1,114.10 326.2 -1.8 -0.55 -4.36 30.72
N Brown Group 926.20 324.6 4.35 1.36 10.46 18.48
Debenhams 923.2 73.75 1.5 2.08 11.15 9.7
Halfords 788.7 391.6 -0.4 -0.1 25.71 11.57
Ao World 753.7 175 9 5.42 21.11 -
Darty 693.7 129  -  - 32.99 60.27
DFS Furniture 667.4 313.1 6.1 1.99 -1.49 72.86
Poundland 419.2 151.25 -14.75 -8.89 -7.03 13.28
Mothercare 311 177.25 -2.75 -1.53 -18.29 14.02
Topps Tiles 286.1 147.5 4.75 3.33 -3.13 21.87
Carpetright 232.1 335.5 -4.5 -1.32 -29.54 50.07
Game Digital 212.5 125  -  - 28.87 9.6
Laura Ashley 181.9 24.75 -0.5 -1.98 -6.54 9.9
McColl’s 172 163 -1 -0.61 19.02 10.62
Findel 162.5 176.75 -48 -21.36 -7.16 5.92
Moss Bros Group 95.9 93 -3.5 -3.63 -2.06 23.1
SCS Group 76.8 190  -  - 17.79 34.14
French Connection 43.5 45 -2.25 -4.76 13.48 12.83
Flying Brands 0.5 1.5 - - -14.29 0.2

AIM-listed companies

 Mkt Cap (£m)Price (p)Change on week (p)Change on week (%)3-month change (%)PE
Asos 2,711.50 3298 226 7.36 7.69 74.28
Mulberry Group 591 981.25 14.75 1.53 0.51 -
Boohoo.com 502.7 43.75 0.5 1.16 19.33 58.36
Conviviality 364.8 237.5 6.25 2.7 9.05 22.23
Majestic Wine 299.2 388.25 -42.5 -9.87 18.74 18.91
Shoe Zone 104 208  -  - 11.53 12.8
Bonmarché 90.8 184.5 4.5 2.5 3.12 8.95
MySale 63.6 41.88 -1.12 -2.62 -5.08 6.58
United Carpets 9.2 11.12 -0.38 -3.26 -17.43 8.21

Source: PA Listings/FT Information