


![Rachel Eyre - Asda - Chief Customer and Digital Officer[99].jpg](https://d53bpfpeyyyn7.cloudfront.net/Pictures/274x183/7/9/0/3127790_racheleyreasdachiefcustomeranddigitalofficer99.jpg_263815_crop.jpeg)


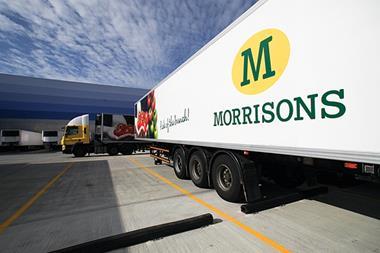
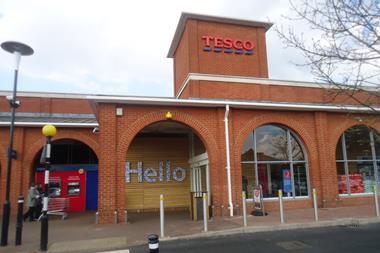
Tesco and Morrisons continued to feel the pressure in a fiercely competitive grocery market and agaisnt tough like-for-likes in the last month.
The latest grocery share figures from Kantar Worldpanel reveal Tesco at 1.9% and Morrisons at 1.2% in the twelve weeks to May 13 while Asda clocked up 6.5% growth and Sainsbury’s 3%.
Tesco’s share stands at 30.8% in the 12 weeks to May 13, down from 31.1% while Morrisons’ share stands at 11.9%, down from 12.1%.
Sainsbury’s remained stable at 16.5% while Asda’s stood at 17.4%, reflecting an increase in share due to the acquisition of Netto.
Aldi and Lidl continue to be the star performers, the former grew 25.4% to achieve a record market share of 2.8% while Lidl grew at 11.3% to retain the same share of the market.
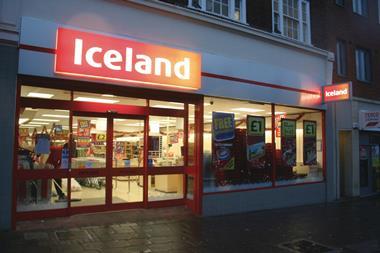
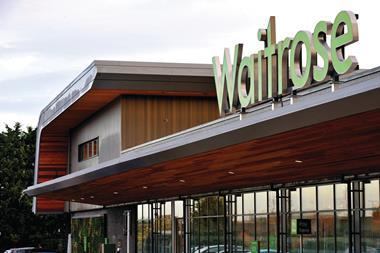
Waitrose continues to outperform the market with 7% growth to hold a market share of 4.5% while Iceland notched up 8.8% growth to take its share to 2% of the grocery market.
The Co-operative recorded a fall in growth rate of 3.5%, as well as a 0.4% loss of market share.
The overall grocery market saw a sharp decrease from 5% growth last quarter to 3.1% this.
Kantar Worldpanel director Edward Garner said: “On the face of it, the declines in market growth might seem alarming but there are exceptional factors. Easter and the Royal Wedding helped year-on-year growth soar to a remarkable 7.6% in the four weeks leading up to May 15 2011 – a hint of what’s to come over the Jubilee weekend.
“Comparing the current figures with the same period two years ago, the four week growth stands at 6.5%. This is actually in line with long-term trends and shows 2011 as the anomaly.”
He added: “The ongoing strong performances of Aldi and Lidl have led some commentators to believe that consumers are deserting conventional stores for the discount sector.
“However, a more realistic picture of shopper behaviour shows that many consumers are continuing to do their main shopping trip in their usual store, but spending the remainder of their household budget on the discounters.”
The full Kantar Worldpanel till roll data is displayed below. It includes all expenditure through main store tills and excludes petrol and in-store concessions.
| 12 Weeks to 15 May 2011 | 12 Weeks to 13 May 2012 | change | |||
|---|---|---|---|---|---|
| £000s | % * | £000s | % * | % | |
| Total Till Roll | 30,944,590 | 31,677,730 | 2.4 | ||
| Total Grocers | 23,392,710 | 100.0% | 24,117,270 | 100.0% | 3.1 |
| Total Multiples | 22,874,720 | 97.8% | 23,581,370 | 97.8% | 3.1 |
| Tesco | 7,286,159 | 31.1% | 7,427,500 | 30.8% | 1.9 |
| Total Asda | 4,084,744 | 17.5% | 4,198,168 | 17.4% | 2.8 |
| Asda | 3,942,734 | 16.9% | 4,198,168 | 17.4% | 6.5 |
| Netto | 142,010 | 0.6% | - | 0.0% | -100.0 |
| Sainsbury’s | 3,863,059 | 16.5% | 3,979,575 | 16.5% | 3.0 |
| Morrisons | 2,826,852 | 12.1% | 2,860,492 | 11.9% | 1.2 |
| The Co-operative | 1,621,240 | 6.9% | 1,564,261 | 6.5% | -3.5 |
| Co-operative | 1,612,577 | 6.9% | 1,564,168 | 6.5% | -3.0 |
| Somerfield | 8,663 | 0.0% | 93 | 0.0% | -98.9 |
| Waitrose | 1,022,694 | 4.4% | 1,094,578 | 4.5% | 7.0 |
| Aldi | 536,763 | 2.3% | 672,997 | 2.8% | 25.4 |
| Lidl | 616,923 | 2.6% | 686,805 | 2.8% | 11.3 |
| Iceland | 443,661 | 1.9% | 482,633 | 2.0% | 8.8 |
| Farm Foods | 140,087 | 0.6% | 142,187 | 0.6% | 1.5 |
| Other Multiples | 432,540 | 1.8% | 472,171 | 2.0% | 9.2 |
| Symbols & Independents | 517,986 | 2.2% | 535,900 | 2.2% | 3.5 |
No comments yet